
In this article:
- Available Admin Reports
- Presenter Report
- Participant Report
- Courses Report (LMS Reporting)
- Teams Report
Admin Reporting provides organization-level insights into presenter activity, participant engagement, LMS course usage, and team activity. These reports help you understand how Poll Everywhere is being used across your organization.
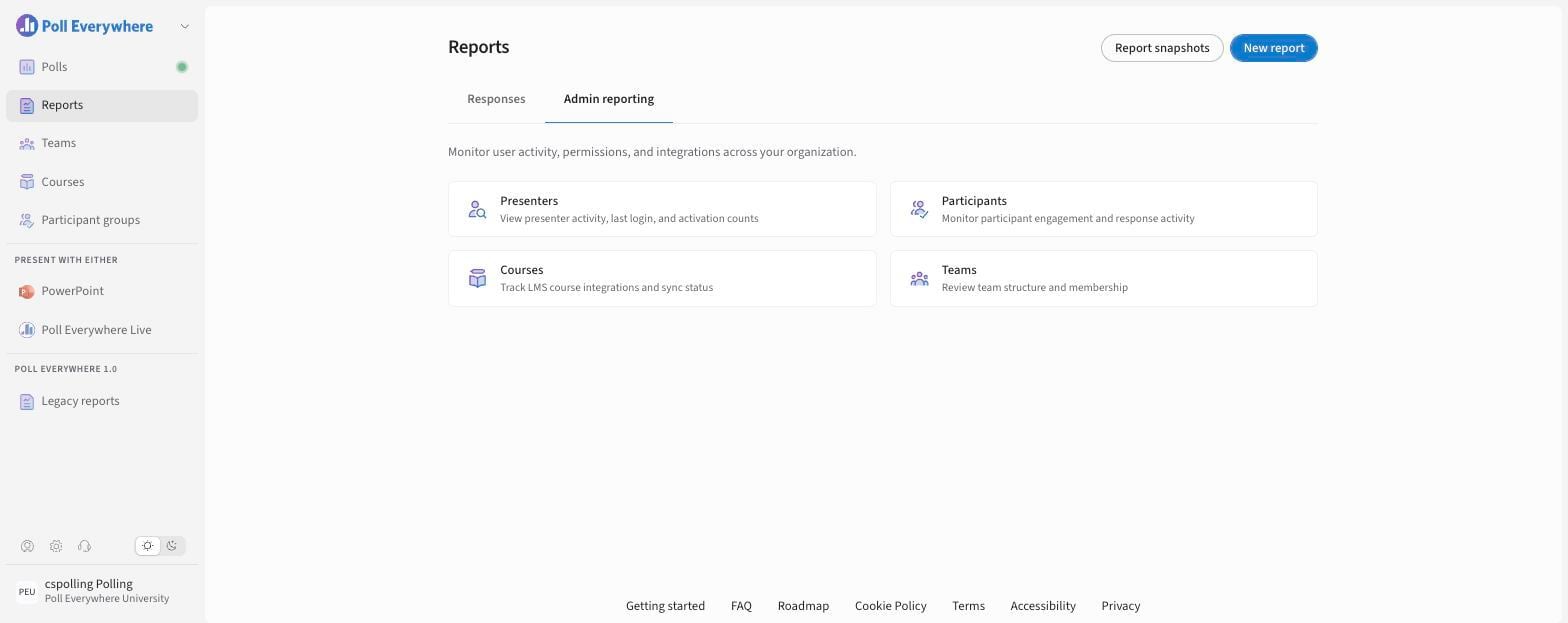
Go to Reports and open the Admin reporting tab (Monitor user activity, permissions, and integrations across your organization).
Available Admin Reports
Admin Reporting includes four report categories:
- Presenters: view presenter activity, last login and activation counts
- Participants: monitor participant engagement and response activity
- Courses: track LMS course integrations and sync status
- Teams: review team structure and membership
Each category includes charts, tables, and filters that help you view and analyze account-wide activity.
Presenter Report
The Presenter report shows all presenters in your organization. It highlights how frequently they activate or create activities over a selected time period.
The report defaults to the last 30 days. You can switch to a previous calendar month, depending on how much historical data is available. Team filters allow you to include or exclude specific groups.
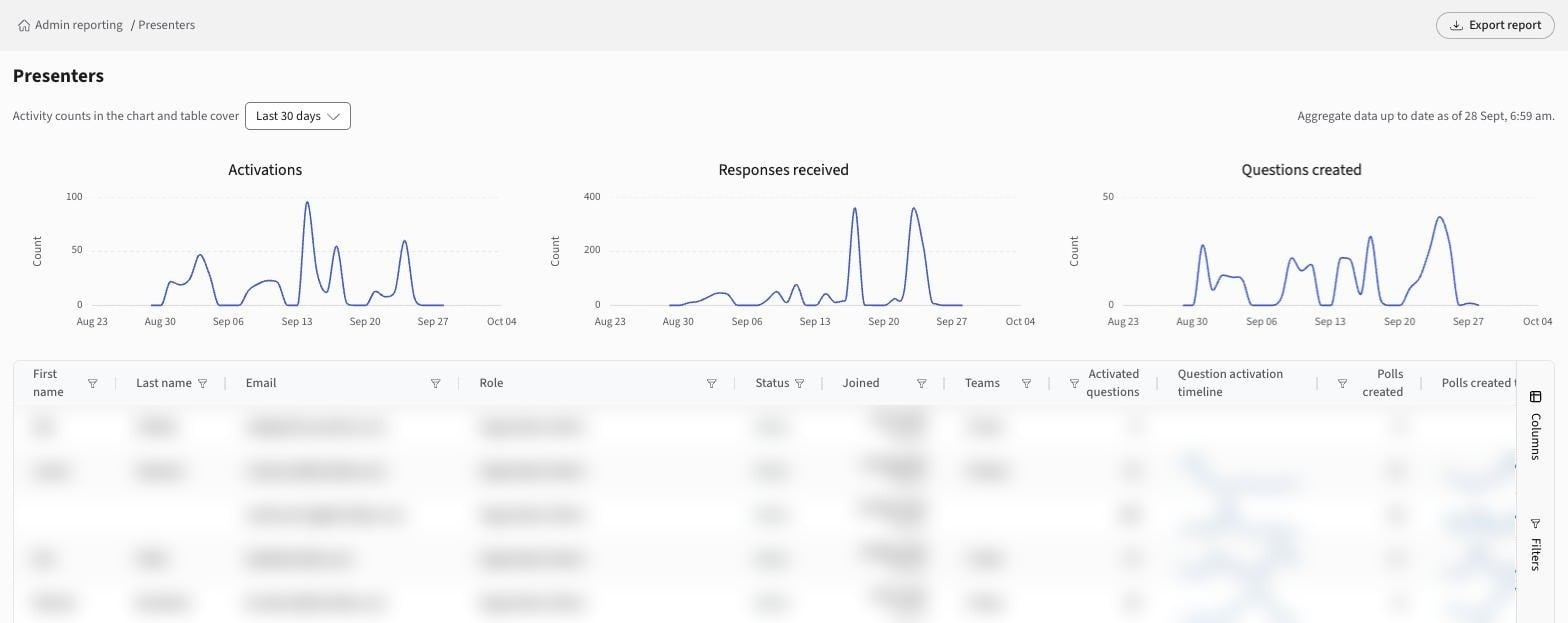
The Presenters report has:
- a date selector (default Last 30 days)
- three charts: Activations, Responses received and Questions created, with an "Aggregate data up to date as of…" timestamp
- a table (First name, Last name, Email, Role, Status, Joined, Teams, Activated questions, Question activation timeline, Polls created and more) with Columns and Filters side panels
- Export report
This report is useful for understanding tool adoption, verifying presenter activity during events or terms, and identifying accounts that may need training or support.
Participant Report
The Participant report summarizes who has responded to polls within the selected date range. It includes charts for response activity and a list of participants who engaged with activities during that time.
Use this report to monitor engagement trends, review audience participation, or analyze response volume during specific events or courses.
Courses Report (LMS Reporting)
The Courses report provides insight into activity within LMS-connected courses such as Canvas, Blackboard, or Moodle.
For each course, you can view:
- Overall activity charts
- The list of course instructors
- Linked Poll Everywhere activities
- Associated teams or groups
This report helps you monitor LMS integration health, confirm instructor setups, and understand which courses actively use Poll Everywhere.
Teams Report
The Teams report provides a view into activity across all teams in your organization. A member is considered active if they have created, activated, or responded to an activity during the selected period.
This report helps you compare activity across departments, identify active teams, and determine where additional onboarding may be helpful.
Note: Reporting data collection is relatively new, so some organizations may see limited historical data or sparse charts for older date ranges. As more activity accumulates, reports will automatically become more complete and detailed.
Need help or have questions? Contact our support team