
Customize a report so it shows exactly the data you need, then save it for next time.
Open a saved report
Go to Reports and select a report under Saved reports.
Choose columns
- Open the Just the data tab.
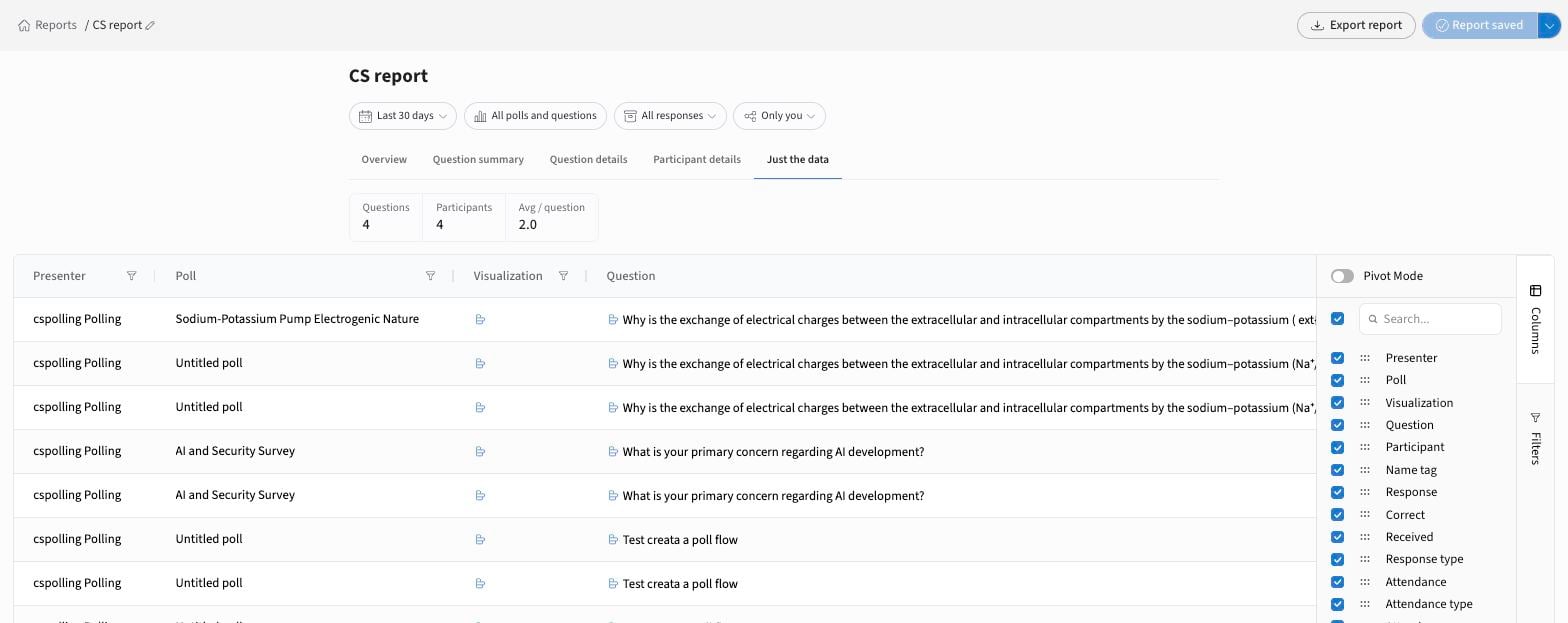
- Select Columns on the right edge.
- Tick or untick columns. The available columns are: - Presenter, Poll, Visualization, Question - Participant, Name tag, Response, Correct, Received - Response type, Attendance, Attendance type, Attendance reason, Archive
- Drag the handles to reorder. You can also drag column headers in the table.
- Turn on Pivot Mode to group and summarize data.
Filter
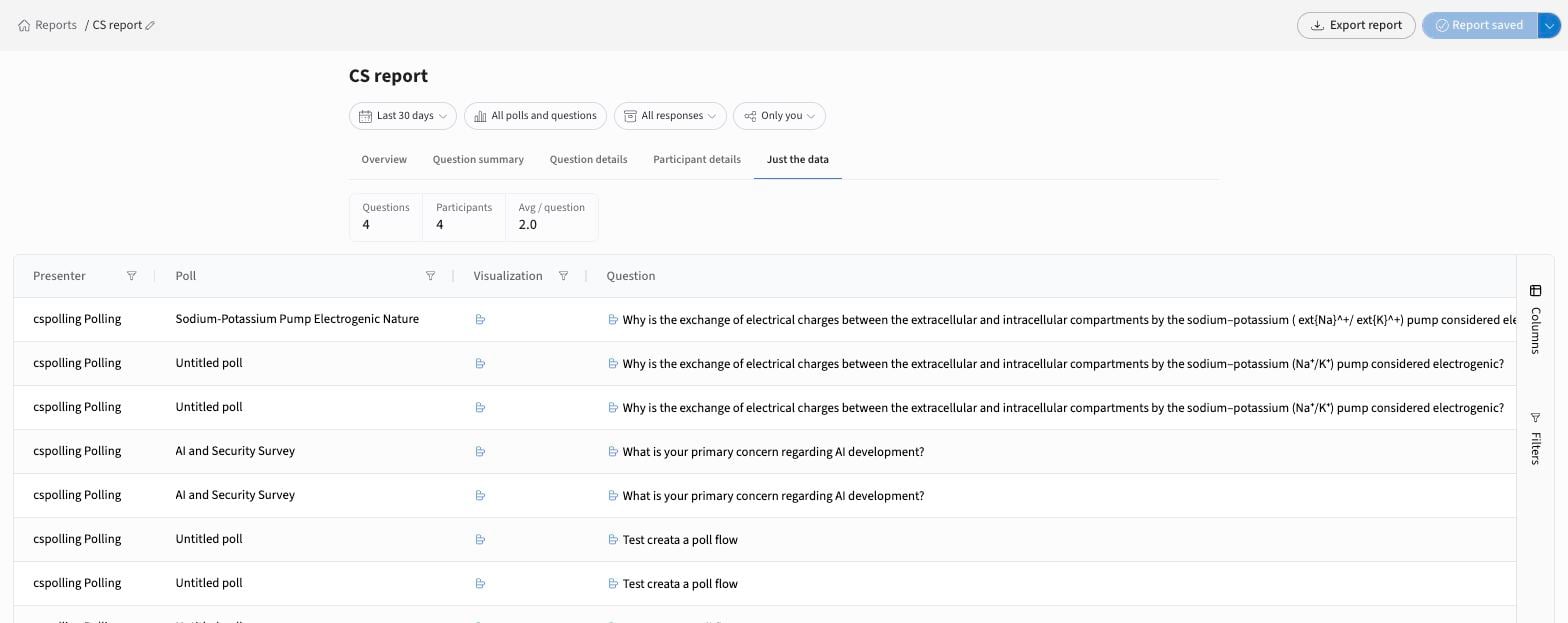
- Select Filters on the right edge, or the filter icon in any column header.
- Use the chips at the top (date, polls, archived responses, presenter) to change the report's scope.
Save as a new report
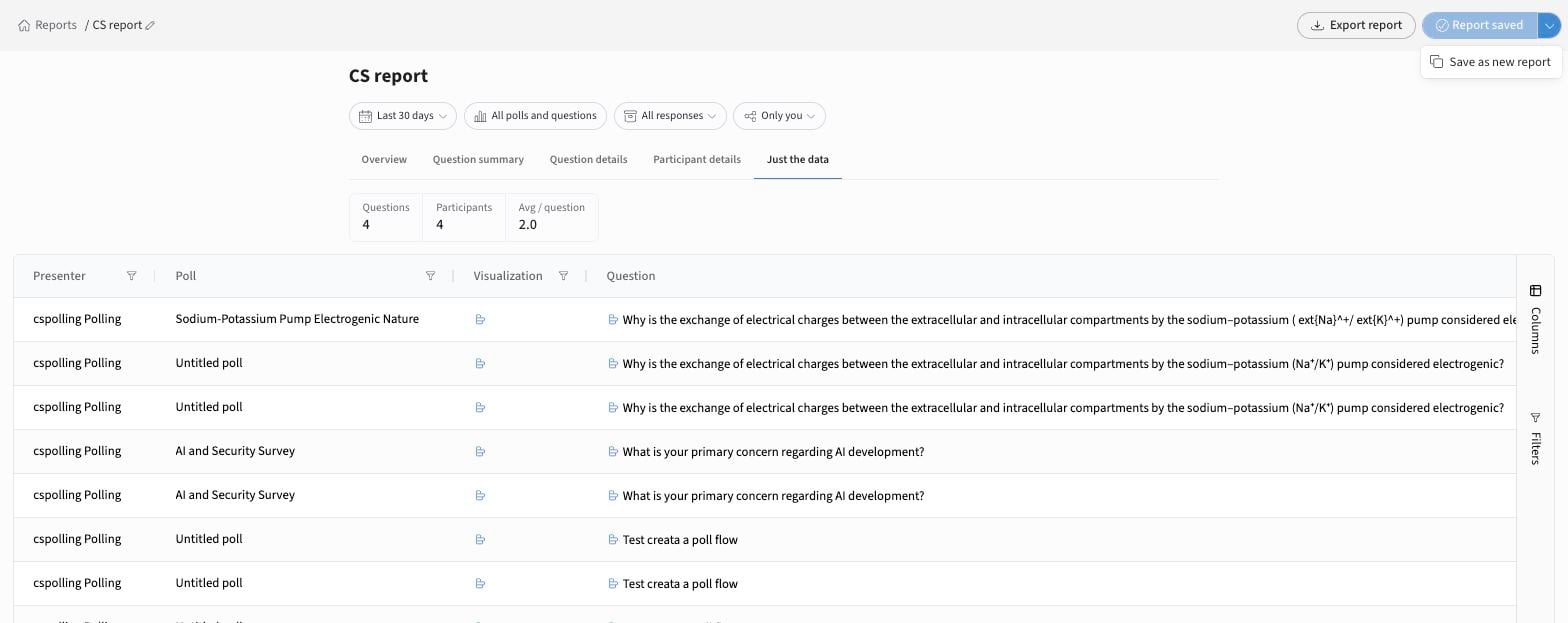
Open the dropdown next to Report saved and select Save as new report. Give it a clear name, e.g. "Attendance — Week 3".
Why save reports?
- Keep one report for attendance and another for quiz scores.
- Admins can save views by course, team or period.
- Each saved report keeps its own filters, columns and layout, and loads fresh data every time.
If you have any questions or run into issues, please contact the Technical Support team.